[[ type === 'moc' ? 'MARKET ON CLOSE' : 'FREE WEBINAR' ]]
[[ timeLabel ]] WATCH LIVE:
Your browser of choice has not been tested for use with Barchart.com. If you have issues, please download one of the browsers listed here.
Less than $10/month! Screen on your Watchlists and Portfolios with Barchart Plus. FREE 30 Day Trial
Stocks | Futures | Watchlist | News | More
or
Wed, Jun 3rd, 2026

Commodity News

RSS icon
Wed, Jun 3rd, 2026
Sugar Prices Turn Mixed on Dollar Strength

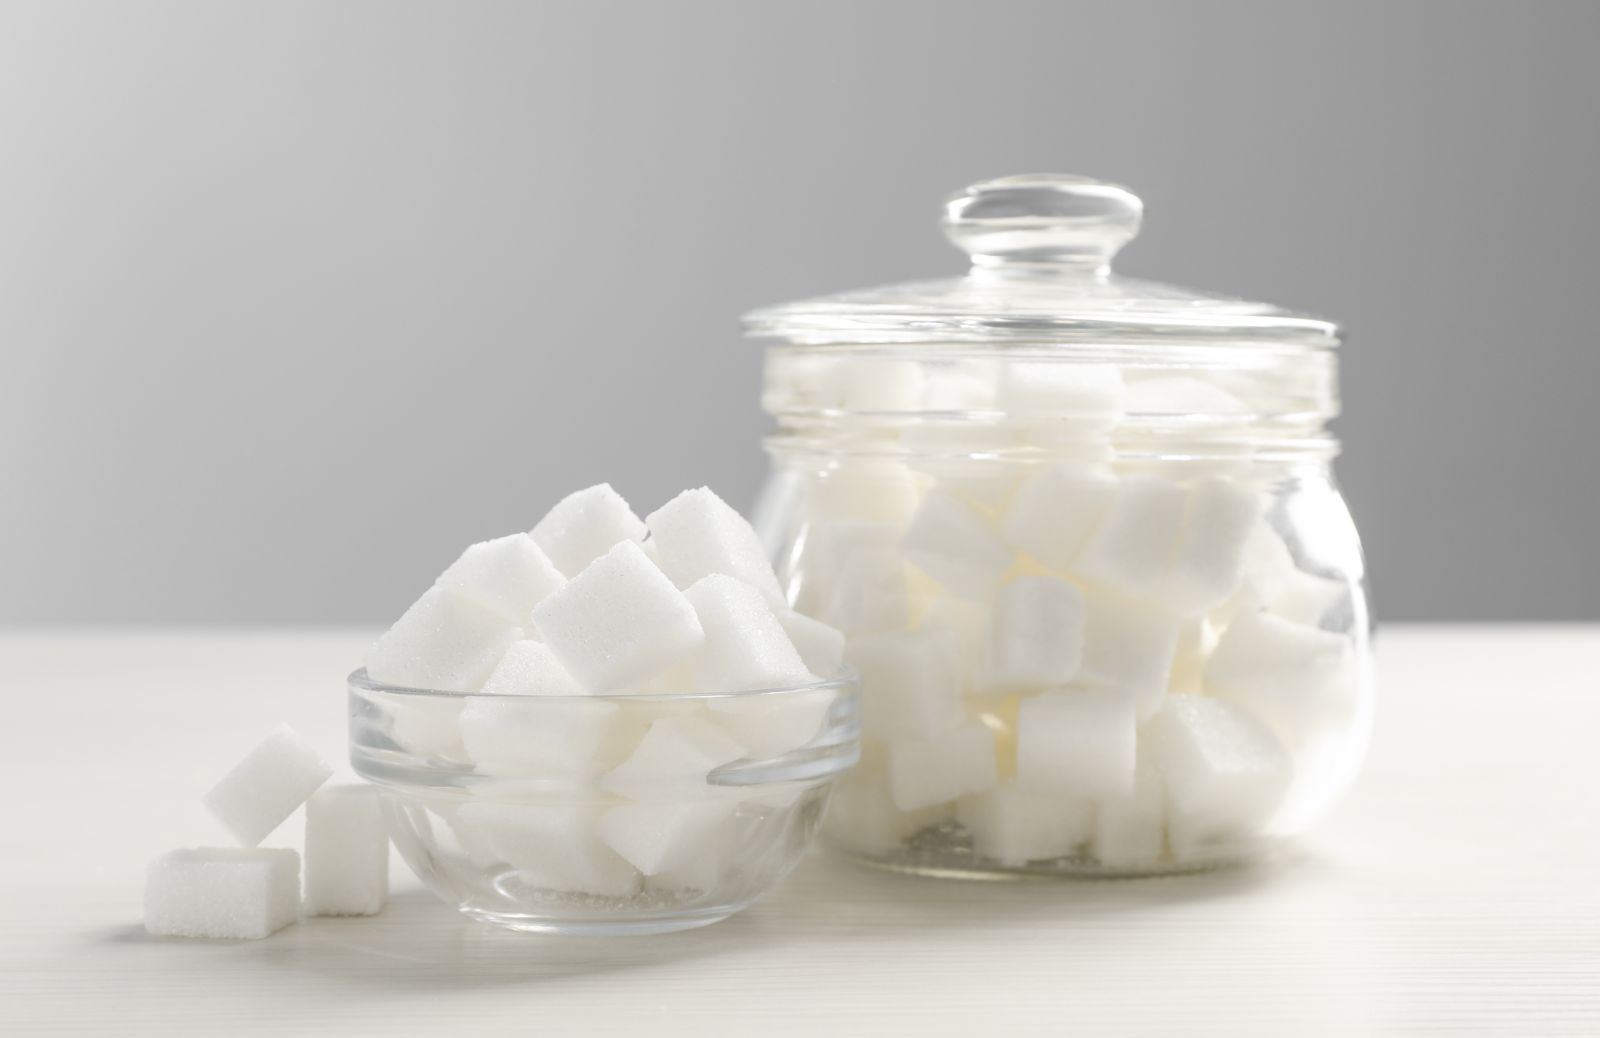
July NY world sugar #11 (SBN26 ) today is down -0.08 (-0.56%), and Aug London ICE white sugar #5 (SWQ26 ) is up +1.60 (+0.36%). Sugar prices fell from early highs today and are mixed, with London sugar...

SBN26 : 14.24 (-0.97%)
SWQ26 : 443.90 (-0.43%)
Chocolate Demand Concerns Weigh on Cocoa Prices

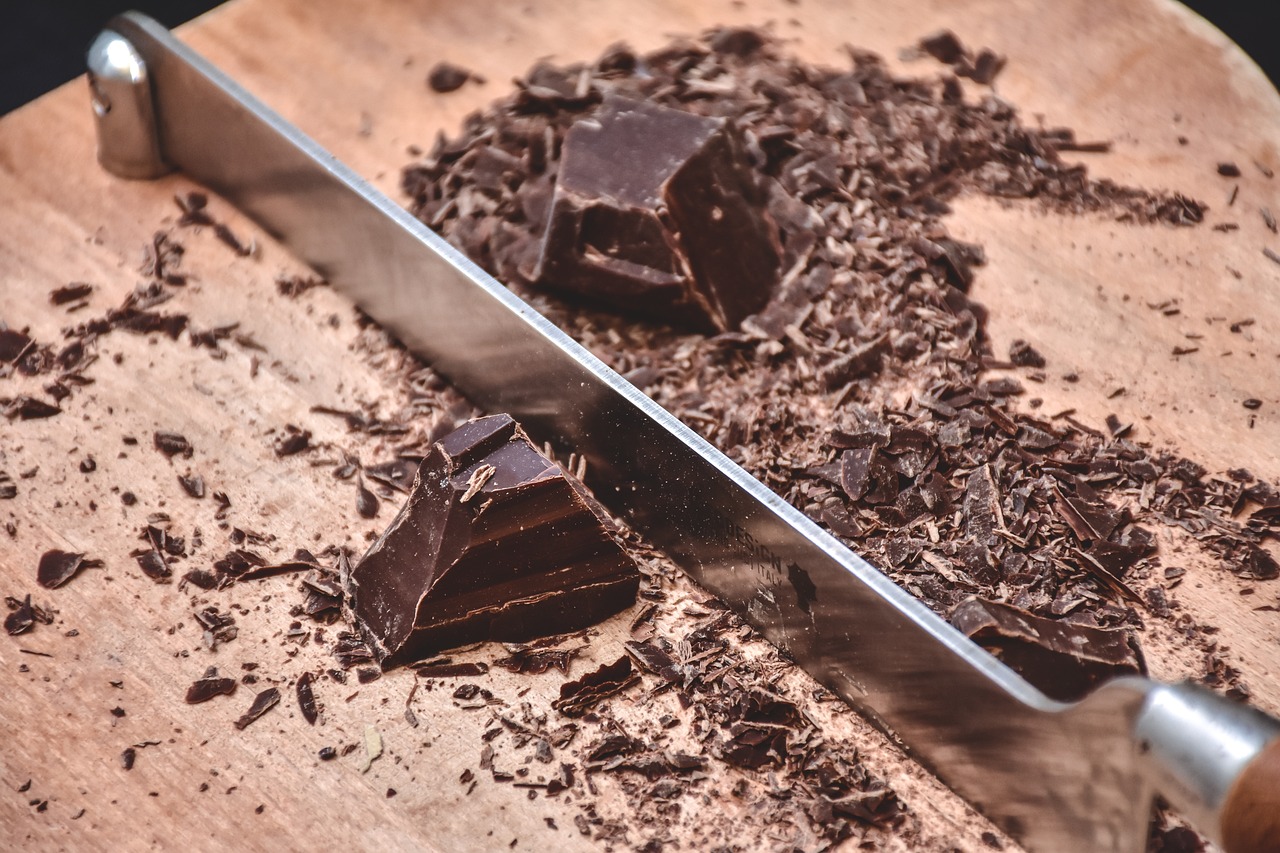
July ICE NY cocoa (CCN26 ) today is down -42 (-1.02%), and July ICE London cocoa #7 (CAN26 ) is down -36 (-1.15%). Cocoa prices came under pressure today on chocolate demand concerns after Barry Callebaut,...

CCN26 : 4,048 (-1.46%)
CAH27 : 3,166s (-0.81%)
Coffee Prices Sink on a Record Brazil Coffee Crop

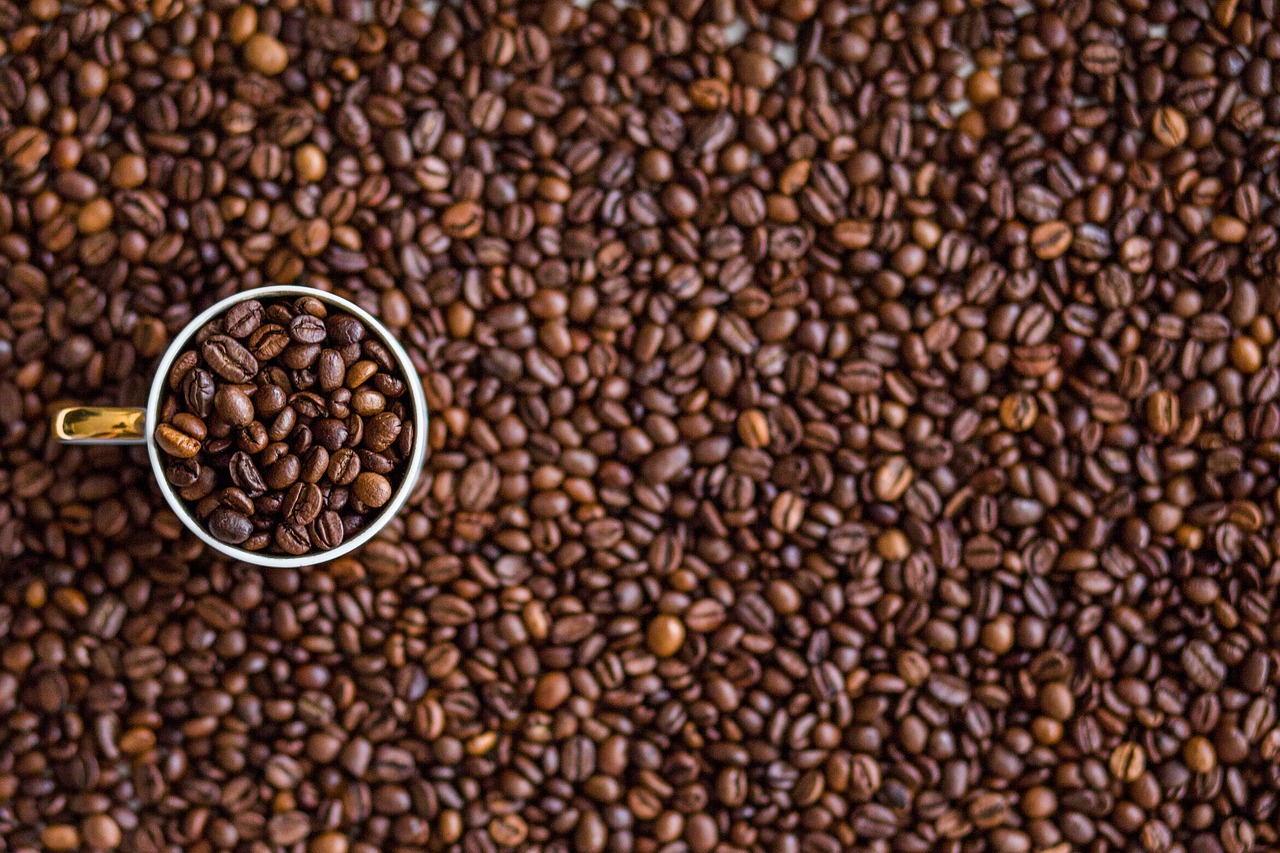
July arabica coffee (KCN26 ) today is down -3.55 (-1.37%), and July ICE robusta coffee (RMN26 ) is down -74 (-2.11%). Coffee prices are retreating today, with arabica falling to a 1.5-year nearest-futures...

RMN26 : 3,371s (-2.63%)
KCN26 : 253.10 (-2.35%)
My 2-Minute Analysis on Gold and Silver Prices in June 2026

Here are my two-minute bull and bear cases on the fundamentals and technicals presently impacting the gold and silver markets, and their potential price implications.

CLN26 : 95.75 (+2.12%)
$DXY : 99.54 (+0.32%)
GCQ26 : 4,467.1 (-1.17%)
DXU26 : 99.250 (+0.33%)
GCQ26 : 4,467.1 (-1.17%)
ESU26 : 7,633.25 (-0.69%)
SIN26 : 73.480 (-2.75%)
CLN26 : 95.75 (+2.12%)
SIN26 : 73.480 (-2.75%)
Crude Oil Prices Gain on Middle East Peace Doubts

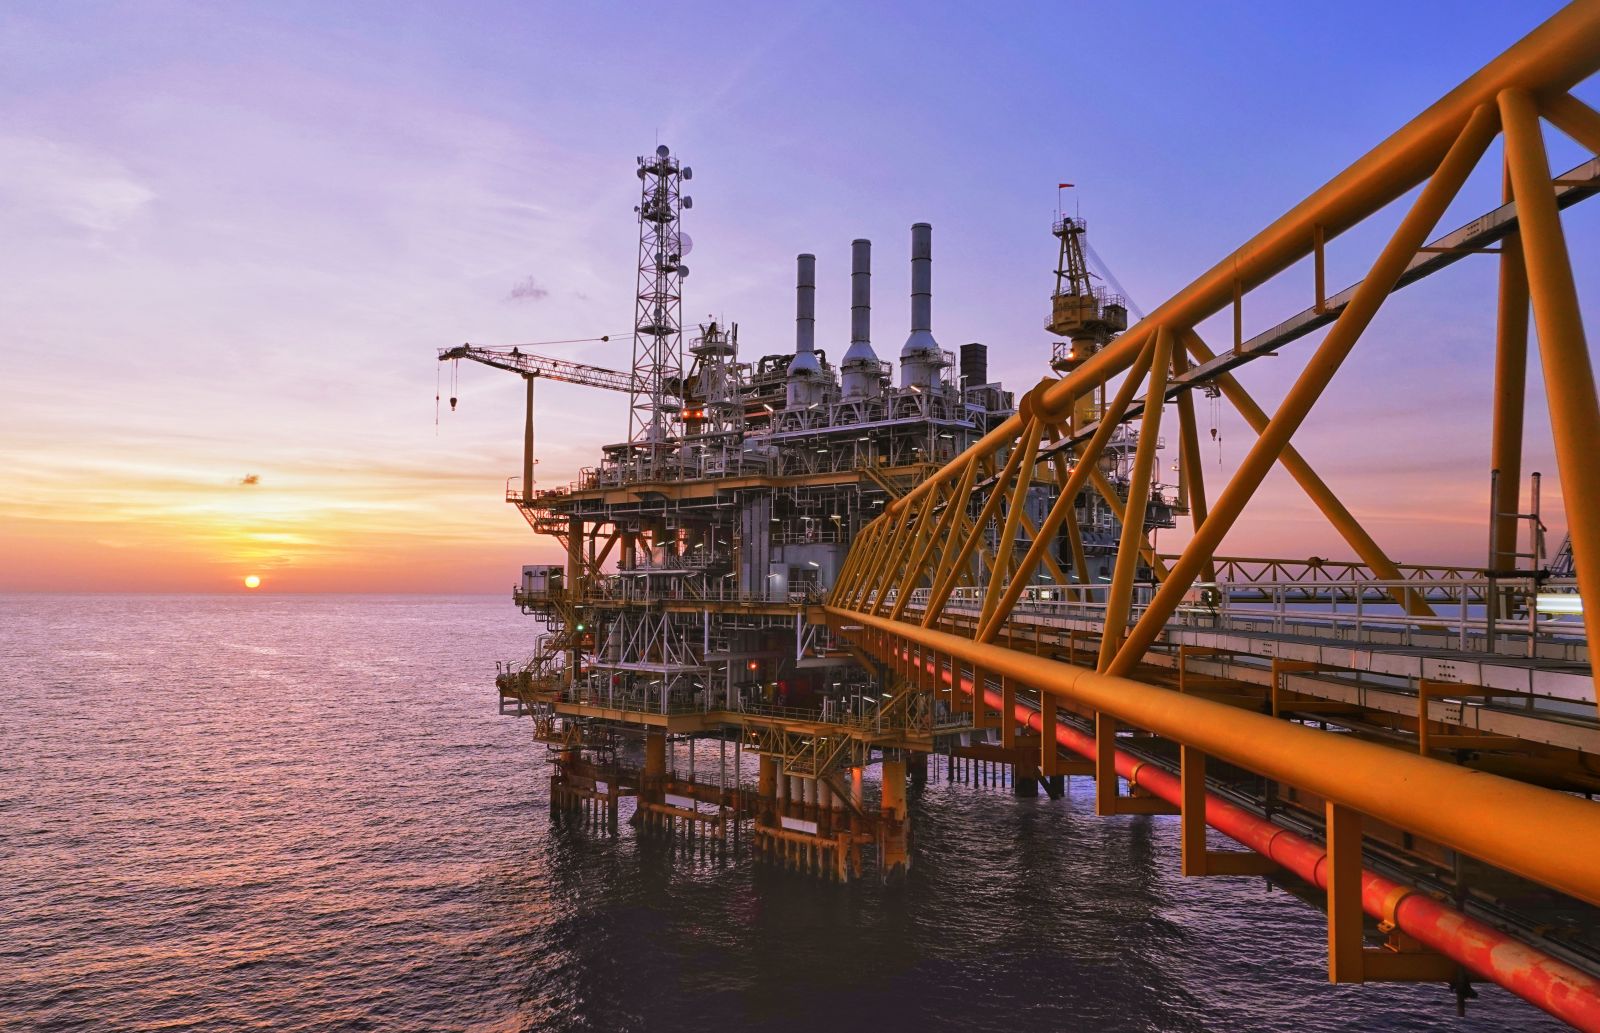
July WTI crude oil (CLN26 ) today is up +1.80 (+1.93%), and July RBOB gasoline (RBN26 ) is up +0.0155 (+0.49%). Crude oil prices are moving sharply higher today, posting a 1.5-week high as clashes between...

CLN26 : 95.75 (+2.12%)
RBN26 : 3.1492 (+0.16%)
Soybean Prices Have Likely Hit a Floor. Wait for These Levels and Then Buy.

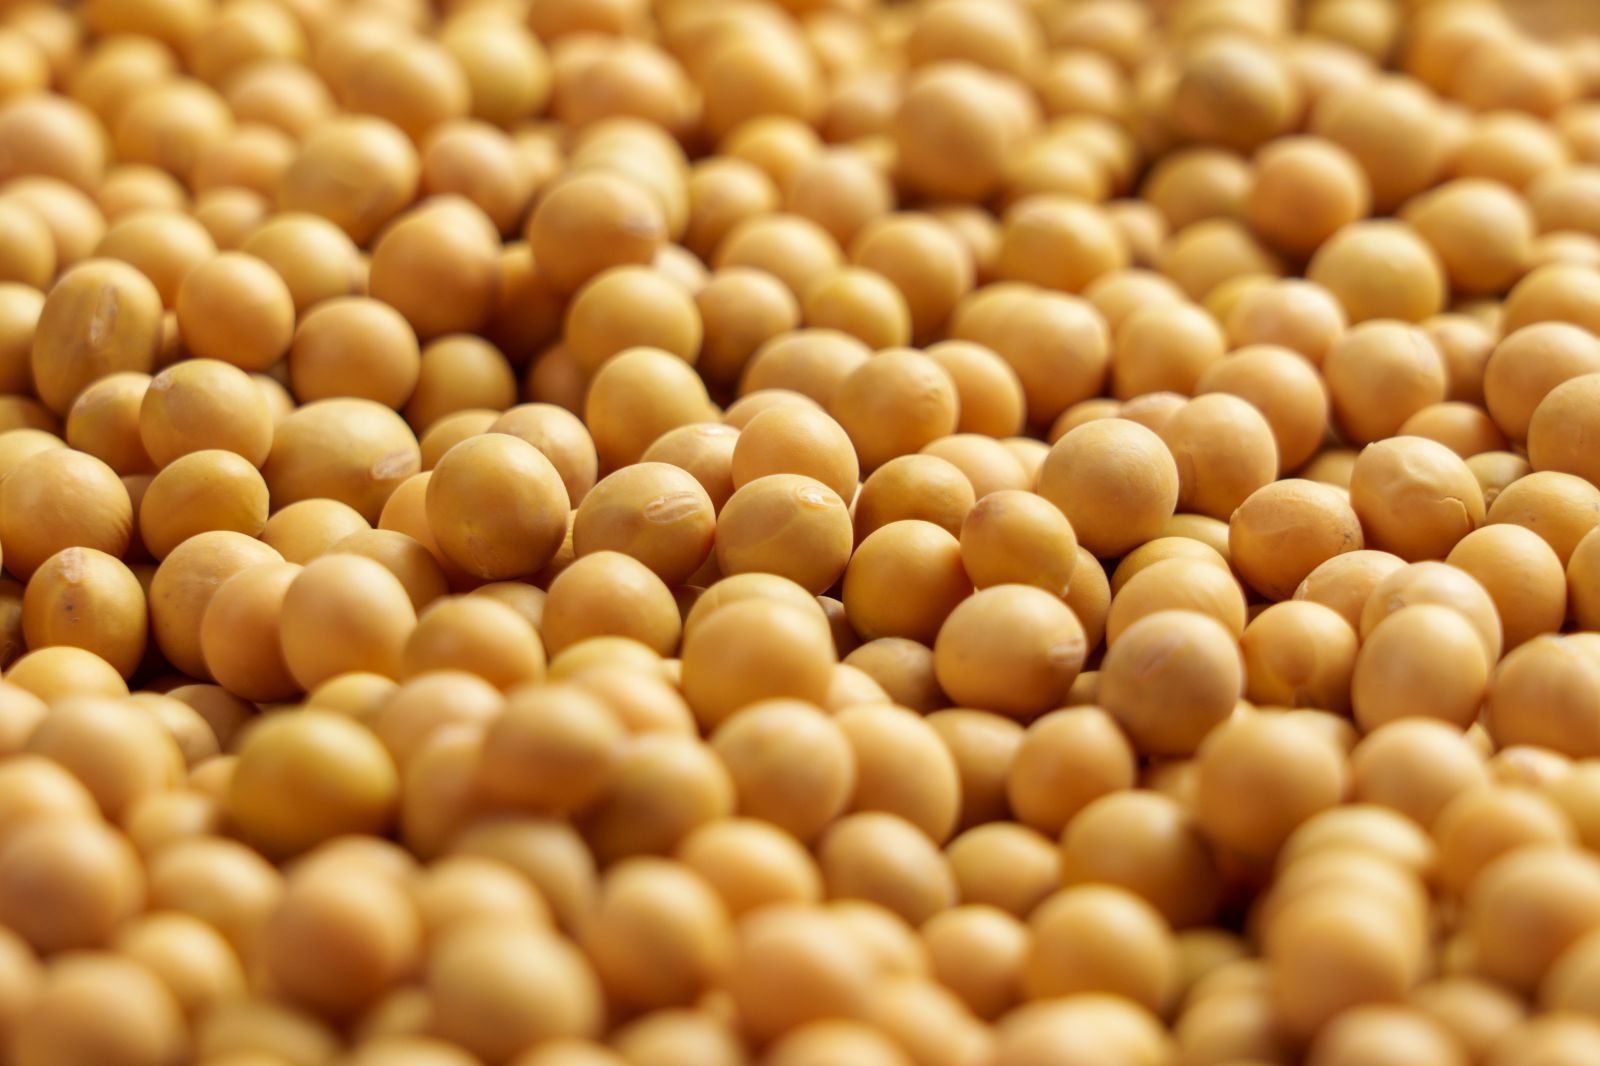
August soybean futures present a buying opportunity on fresh price strength.

ZSQ26 : 1162-6 (-0.53%)
Alcoa Stock Is Up 10% Over the Past 5 Days as Aluminum Prices Hit 4-Year High

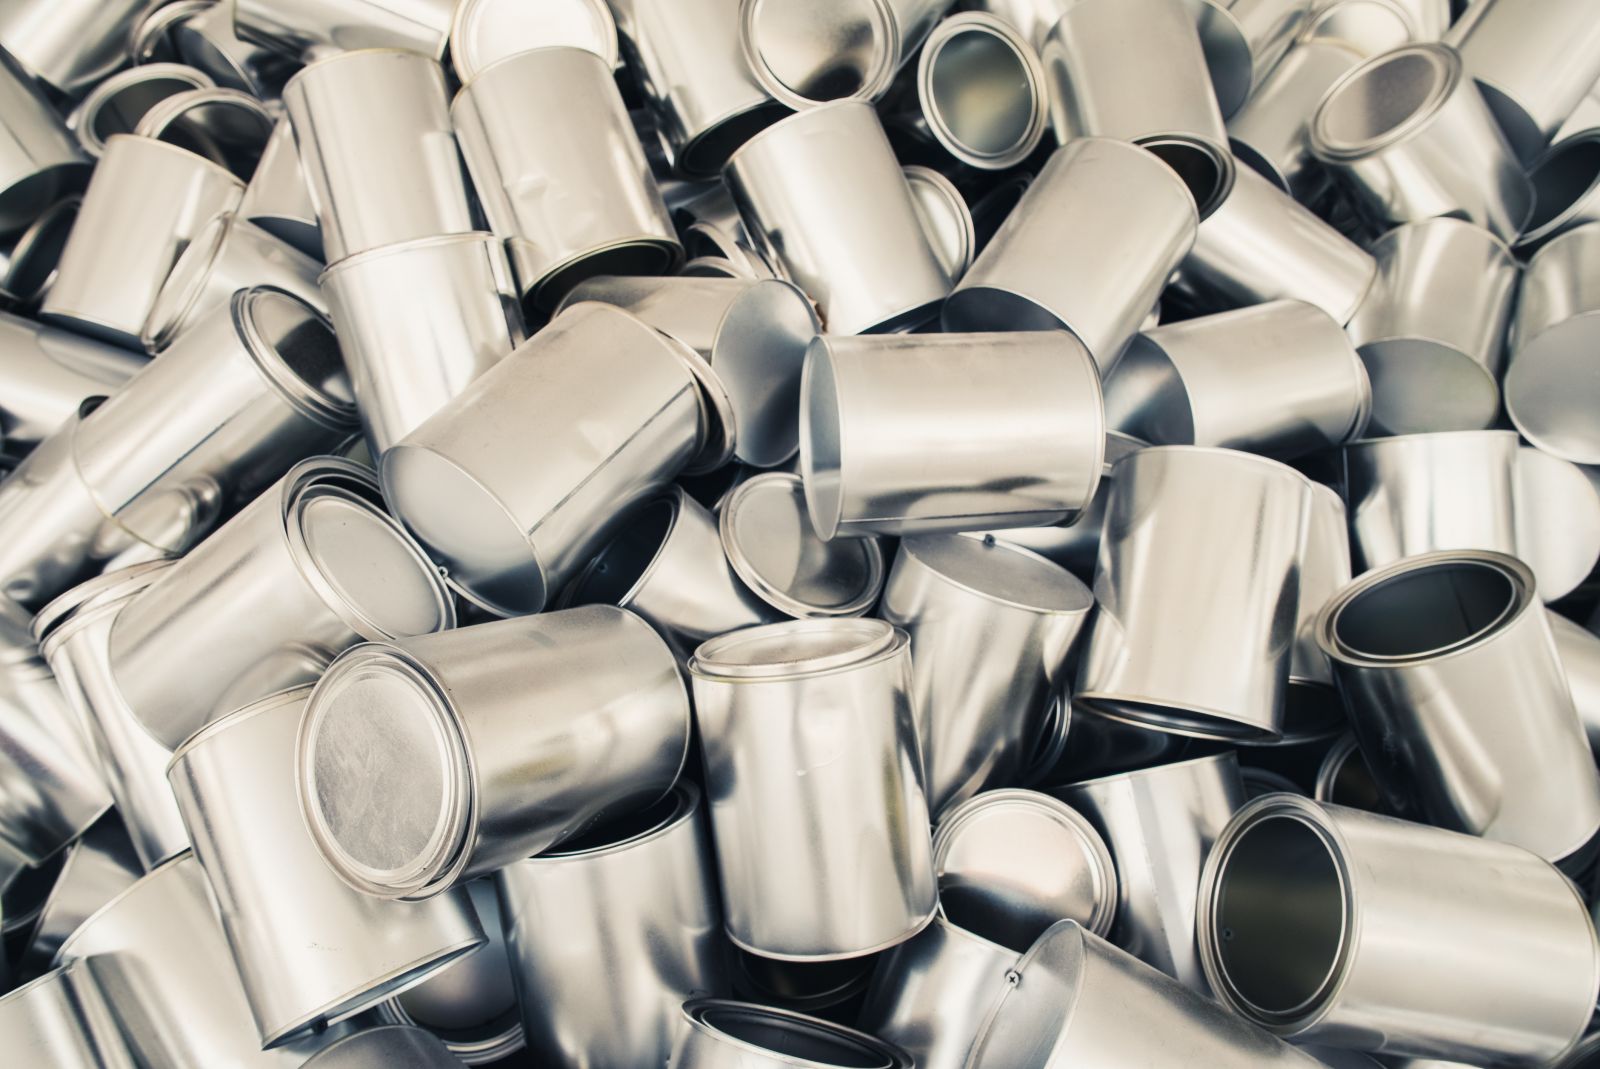
Alcoa stock extends gains as aluminum prices climb further to a four-year high. Here’s why AA shares remain worth buying at current levels.

AA : 81.44 (-2.80%)
Strength in US Economic Reports Boosts the Dollar

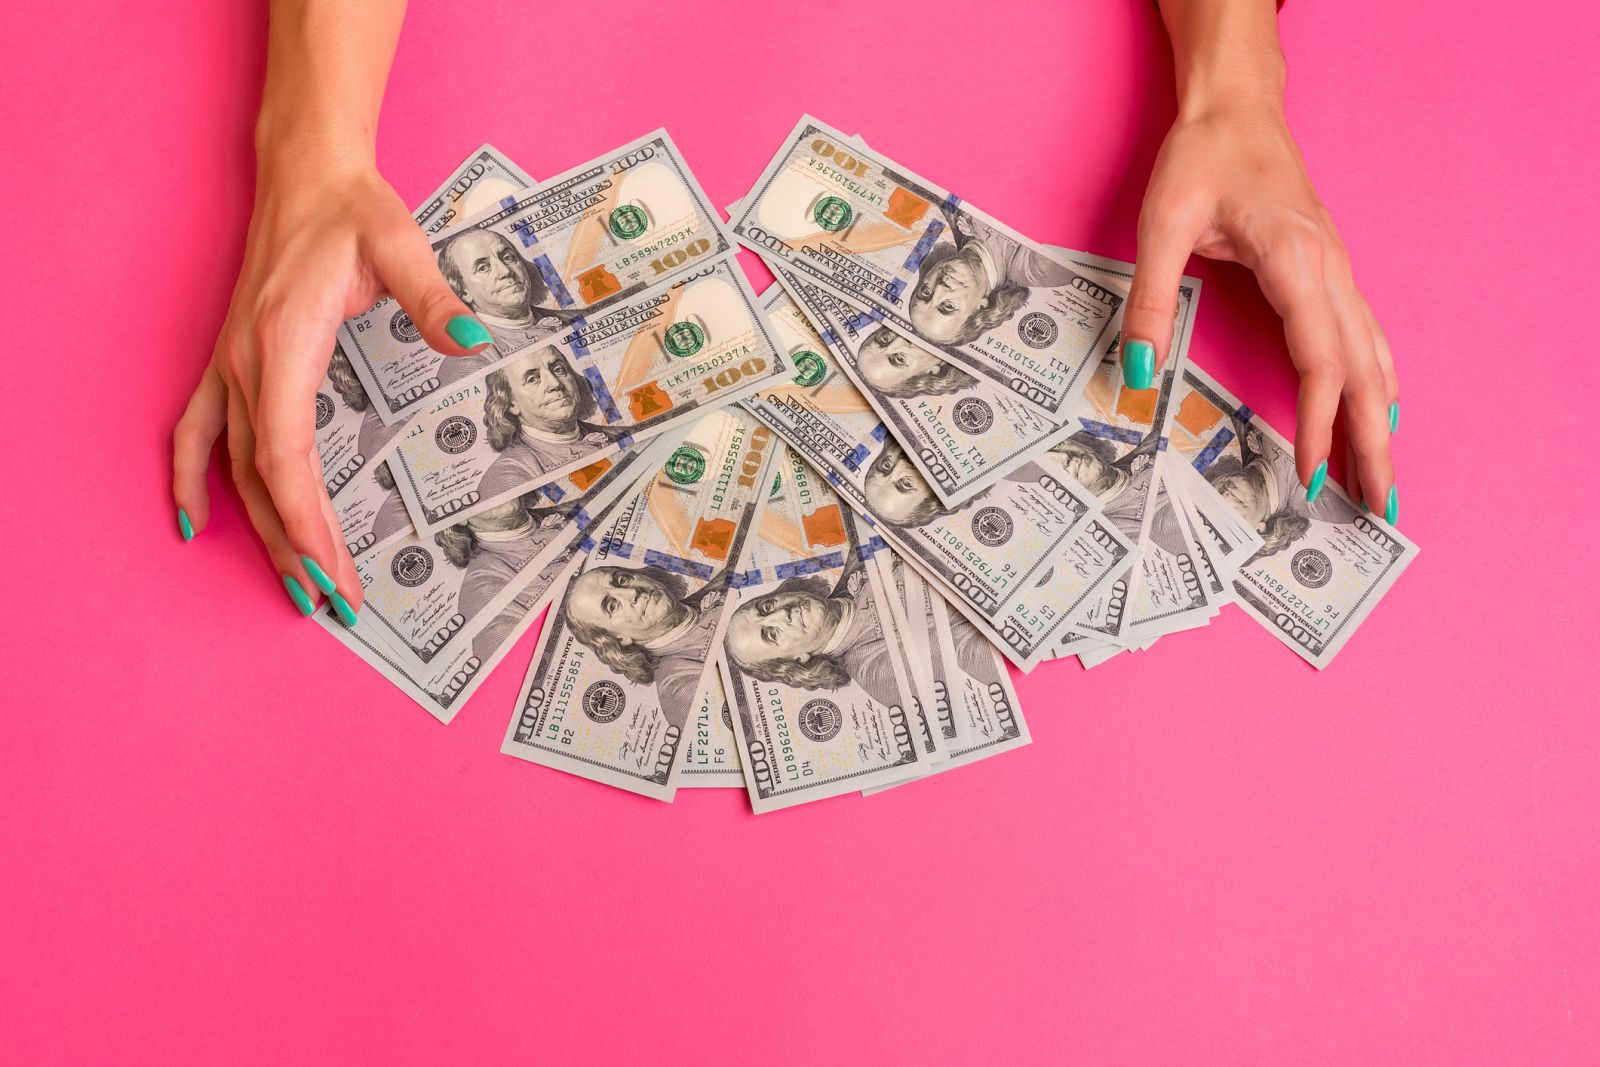
The dollar index (DXY00 ) today is up by +0.23%. The dollar is moving higher today and is being supported by a +1% increase in WTI crude oil prices, which lifts inflation expectations and may prompt the...

DXY00 : 99.541 (+0.32%)
GCQ26 : 4,467.1 (-1.17%)
SIN26 : 73.480 (-2.75%)
^USDJPY : 160.014 (+0.06%)
^EURUSD : 1.15961 (-0.30%)
Hog Traders Look to the Midweek Session

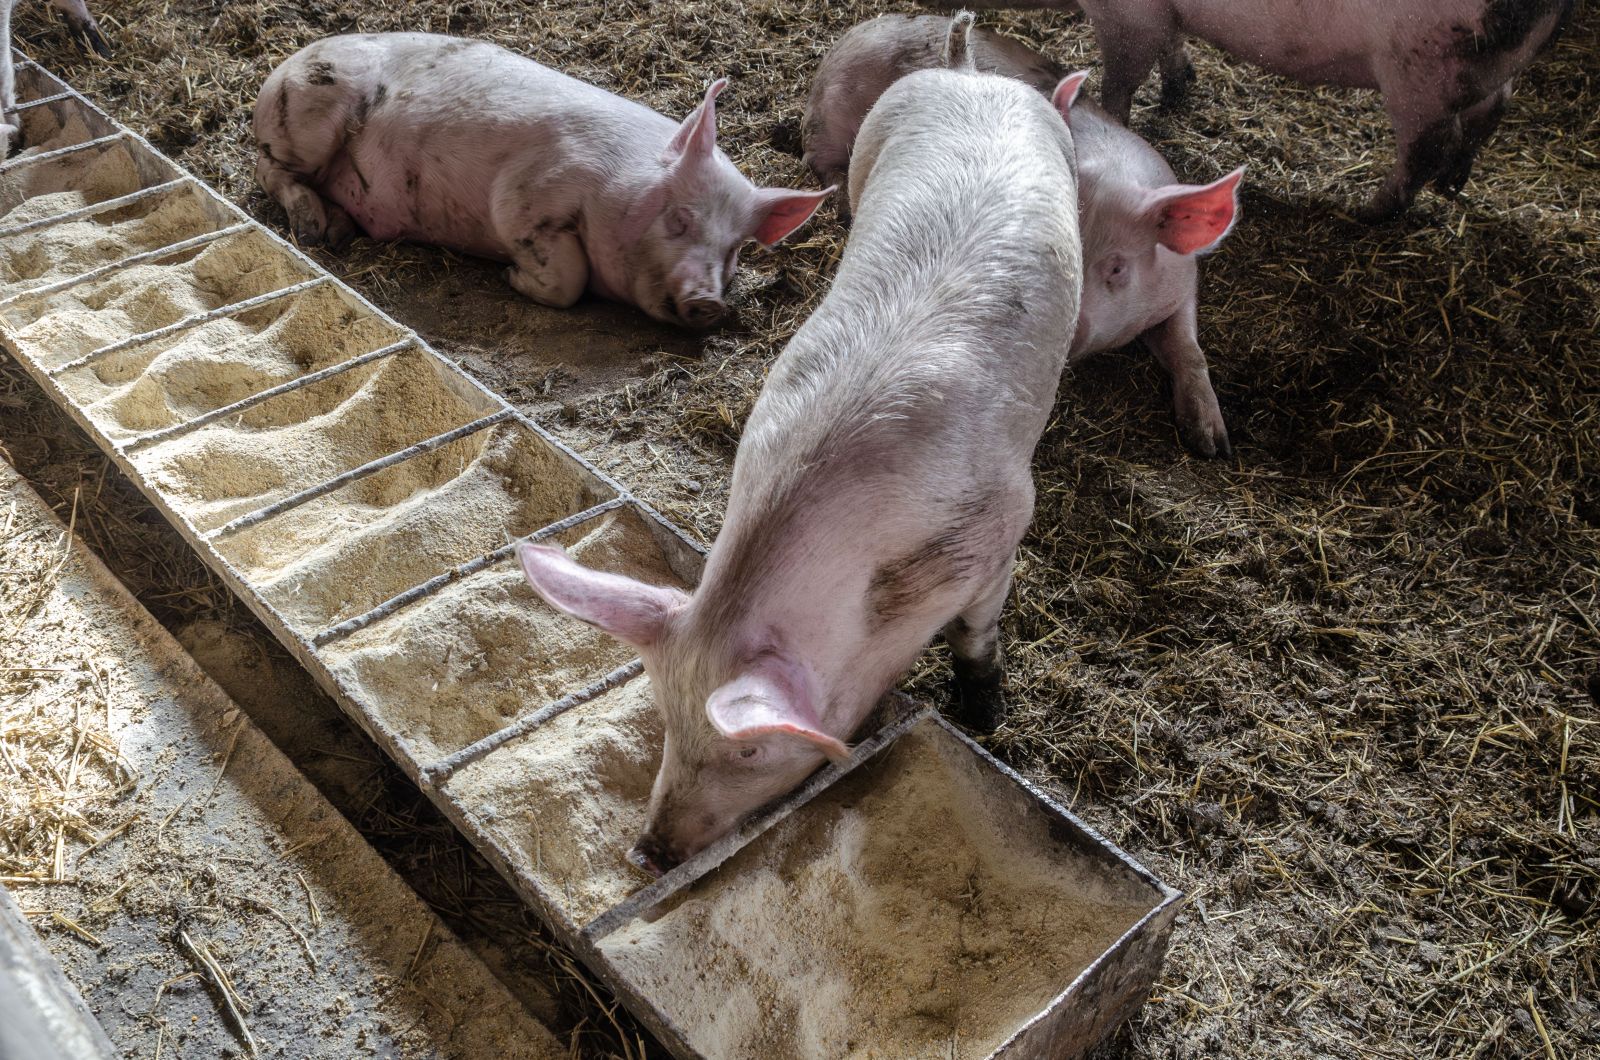
Lean hog futures closed the Tuesday session with contracts 35 cents to $1.80 higher. Open interest was up just 358 contracts on the day. USDA’s national base hog price was reported at $95.57 on Tuesday...

HEN26 : 101.675 (+0.02%)
HEM26 : 96.150 (+0.47%)
HEQ26 : 99.575 (+0.61%)
Cattle Look to Wednesday Follow Tuesday Correction Lower

Live cattle futures were down 95 cents to $1.80 across the board on Tuesday. Open interest suggested a rotation of ownership, up just 40 contracts. Cash trade started to creep in this week at $255 in the...

LEV26 : 230.150 (-0.31%)
LEQ26 : 239.200 (-0.19%)
LEM26 : 247.225 (-0.18%)
GFU26 : 342.750 (-0.69%)
GFQ26 : 346.225 (-0.63%)
GFV26 : 339.150 (-0.76%)
Tue Jun 2, 10:50AM CDT
Sign up for our free Chart of the Day with expert stock ideas to stay ahead of market trends and uncover new trading opportunities.
Want to use this as
your default charts setting?
Save this setup as a Chart Templates
Switch the Market flag
for targeted data from your country of choice.
Open the menu and switch the
Market flag for targeted data from your country of choice.
Want Streaming Chart Updates?
Switch your Site Preferences
to use Interactive Charts
Need More Chart Options?
Right-click on the chart to open the Interactive Chart menu.
Use your up/down arrows to move through the symbols.