Gasoline RBOB Sep '15 (RBU15)
Symbol Historical Price Data Downloads
Barchart offers two great products for Historical Market Data:
A Barchart Premier Membership lets you download historical price data for any publicly available symbol we carry in our database. Access Stocks, ETF’s, Mutual Funds, Futures, Commodities, Forex and Cryptos - you can download daily data back to the inception of our database, or 1-minute data going back 10-years.
- Intraday data is available, down to 1-minute increments, approximately 10 years prior to today’s date.
- Daily data is available back to 01/01/2000.
- Weekly, Monthly, and Quarterly data is available back to 01/01/1980 (depending on the symbol).
- Up to 10 daily downloads (Barchart Plus) or 250 daily downloads (Barchart Premier), whether individual symbol price history, your Screener results, Watchlists, or for other popular Barchart pages.
- Download additional underlying chart data and study values for any symbol using the Interactive Charts.
- Get 1000 daily downloads, including options data, with a Barchart Premier membership
Get More Download Flexibility On Historical Data With Barchart for Excel
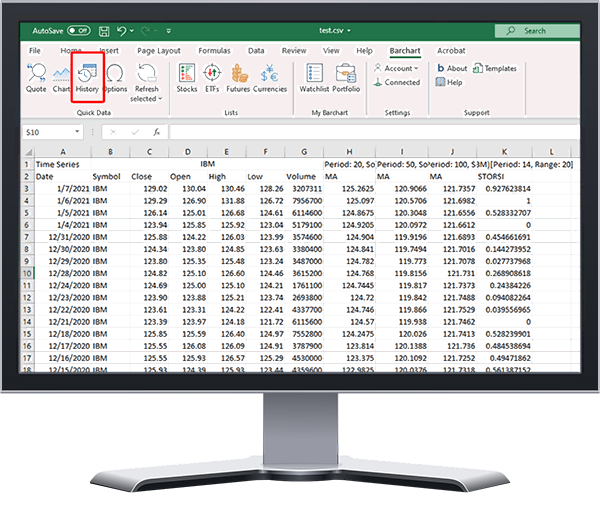
Barchart for Excel is a powerful tool designed to enrich the data you can find on Barchart.com, but with the added power and flexibility of Microsoft Excel. Blend Barchart data with your own proprietary data, perform calculations, visualize data, and perform sophisticated data analysis directly in Excel. 2-Week Free Trial - No Credit Card Required!

With Barchart for Excel:
- All the Historical Data Download features from Barchart Premier, PLUS ...
- No restrictions on historical start dates, Intraday data back to 01/01/2009 and Daily data back to 01/01/1980.
- Tick data available, along with optional subscription to real-time exchange data.
- Download an unlimited amount of financial data directly into your spreadsheets, up to 100,000 rows of data.
- Easily blend data from Barchart with your own proprietary data or other 3rd party data sources directly in Excel.
- Pull historical data into Excel for deeper analysis with 3rd party tools/languages such as MATLAB, R, Python and others.
- Apply study data from nearly 100 technical indicators directly to Excel.


