Hello All:
Is 2023 the new 2021 when valuation analysis goes out the window again? Everyone is talking about the new bull market arriving. I COMPLETELY AND UTTERLY disagree. Of course, if you watch the MSM, you will think everything is ok. If you follow BLS data closely, it appears that everything is okay but we know that there is manipulation going on.
I will caution the bulls with the following analysis and historical charts. Why am I NOT bullish? There are 3 charts that I look at that tell me that the stock market has reached a short-/ medium-term peak and is set for a fall.
- 1) Russell set a bearish DOJI on daily chart on Friday
- 2) VIX is not painting a bright picture at all as it put in a supportive DOJI
- 3) DRV also put in a supportive DOJI on Friday

In bear markets, we have generally seen the Russell (small cap index) lead the way down for the whole equities complex.
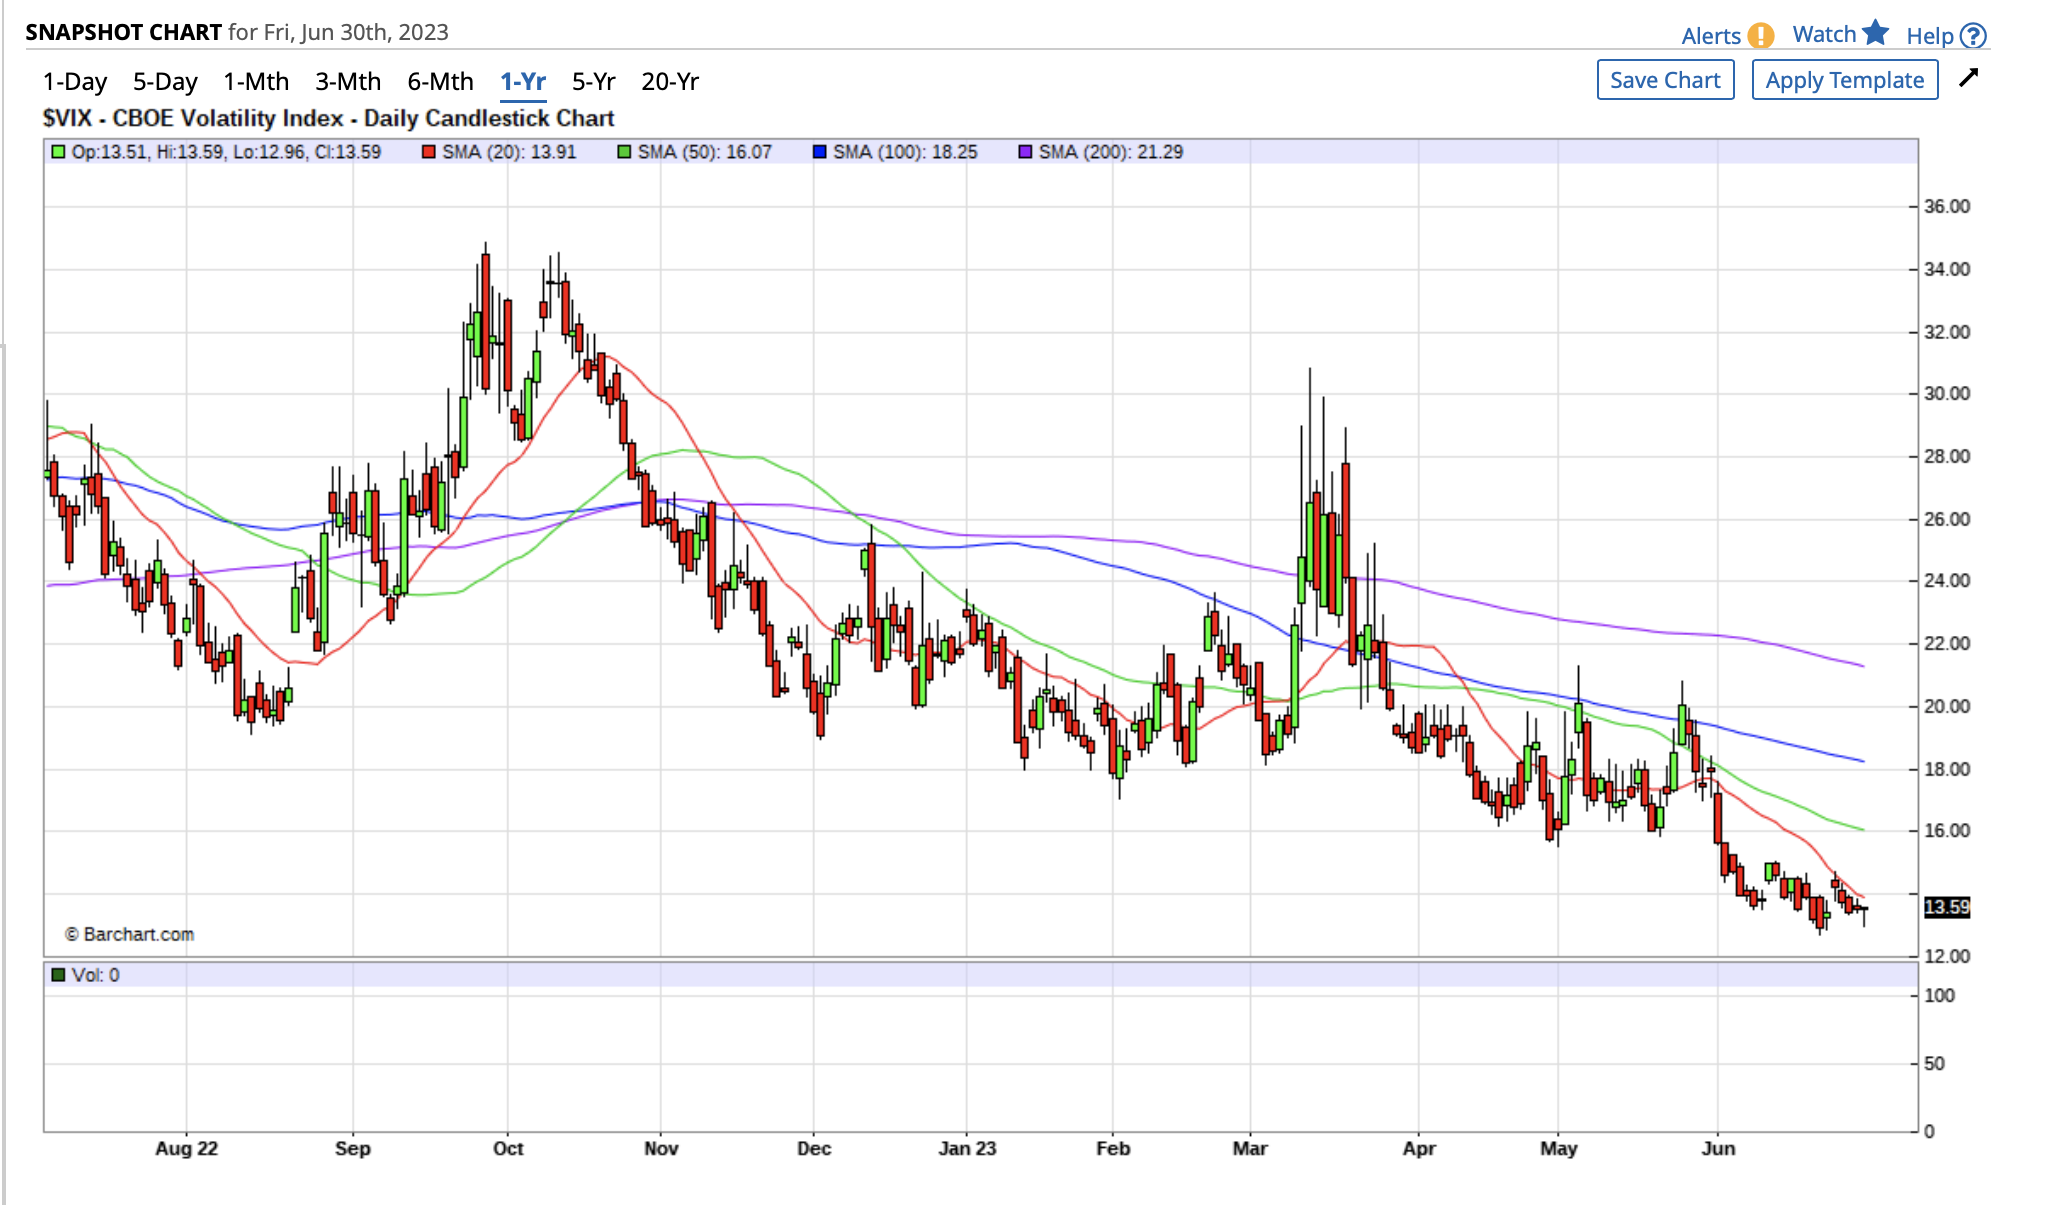
A Hammer doji is clearly seen on Friday's price action. While the stock indices like ES, YM and NQ were purely rallying, the VIX is telling us a different story. Also, keep in mind that the volume on the ES, YM and NQ rallies was also very LOW in comparison to the rally we saw earlier in June. That means this latest rally is purely hyped up with no really big players.

THIS ANALYSIS tool (using the Bearish RE ETF DRV) tells us that the stock market has also topped at current levels as DRV is showing a strong sign of reversal with the inverted hammer support Doji on Friday.
Furthermore, we look at other relative/ spread charts for a more in-depth analysis of the underlying directions in these equities markets.
The First one is ES vs. Russell spread:

The spread looks overwrought from the perspective of both RSI and MACD analyses tools. A reversal is imminent meaning that ES will start breaking down relative to Russell. One of the ways to explain this is the AI mania. The majority of the move in 2023 has been driven by the AI mania/ surge higher in the tech stock sector. I think that this is short-lived although the bulls want to push it higher. However, the technicals as per above and the Russell chart are telling us different.
If it weren't for the AI rally, the stock market would look quite different according to this twitter post:

I have been saying this for a while, but this is a good tool to measure where would we be if we didn't get the BULL MOVE from the AI help.
The mini-Dow also compares relative calm vs. the Russell in the spread chart below:

The dow, that is a more traditionally based company index, is showing us that relative to the small caps, the market really has not moved that much this year at all.
The tide is changing and if you are not ready, you will be lost. AND you will suffer losses.
Reach out to me if you need help in planning the next 6-12 months. We have tools available to hedge your portfolio as well as trading tools for those
that want to speculate in what will be a tremendous opportunities in the next 1-3 months. Things will immensely change. BE READY!
I am offering a 6:1 TRIAL FOR our Market Signal Service. A total of $ 475 will get you 6 months of weekly Market Comments (and Updates)
and email/ text MARKET SIGNALS. Go to our website to learn more.
Best Regards
Edgard Cabanillas
President - Alpine Trading LLC
TEL: 949-357-4948
Email: edgard@alpine-trading.net
*** RISK DISCLAIMER: PAST PERFORMANCE IS NOT NECESSARILY INDICATIVE OF FUTURE RESULTS. TRADING
COMMODITIES FUTURES AND OPTIONS IS SPECULATIVE, INVOLVES RISK OF LOSS AND IS NOT SUITABLE FOR ALL INVESTORS
On the date of publication, Edgard Cabanillas did not have (either directly or indirectly) positions in any of the securities mentioned in this article. All information and data in this article is solely for informational purposes. For more information please view the Barchart Disclosure Policy here.

/Tesla%20Inc%20tesla%20by-%20Iv-olga%20via%20Shutterstock(1).jpg)
/Stickers%20with%20AMD%20Radeon%20and%20Nvidia%20GeForce%20RTX%20graphics%20on%20new%20laptop%20computer%20by%20Piotr%20Swat%20via%20Shutterstock.jpg)