Fund Basics
See More- Fund Family Invesco
- Assets Under Management 387,600,000
- Shares Outstanding, K 11,400
- 60-Month Beta 1.56
- Price/Earnings ttm 15.08
- Annual Dividend & Yield 0.27 (0.79%)
- Most Recent Dividend 0.069 on 03/24/25
- Management Fee 0.19%

| Period | Period Low | Period High | Performance | |
|---|---|---|---|---|
| 1-Month | 32.53 +4.52% on 03/31/25 |
Period Open: 37.56
| 38.12 -10.81% on 03/03/25 | -3.56 (-9.48%) since 02/28/25 |
| 3-Month | 32.53 +4.52% on 03/31/25 |
Period Open: 39.51
| 43.50 -21.84% on 01/22/25 | -5.51 (-13.95%) since 01/02/25 |
| 52-Week | 32.53 +4.52% on 03/31/25 |
Period Open: 38.51
| 46.82 -27.38% on 07/11/24 | -4.51 (-11.71%) since 04/02/24 |

investors see more demand for AI hardware, which makes these three sector-specific ETFs an attractive way for investors to get exposure to chip stocks

U.S. stocks rallied on Monday, buoyed by gains in the technology sector and optimism surrounding chipmakers. Semiconductor stocks soared after Foxconn, a key NVIDIA NVDA server partner, reported record...

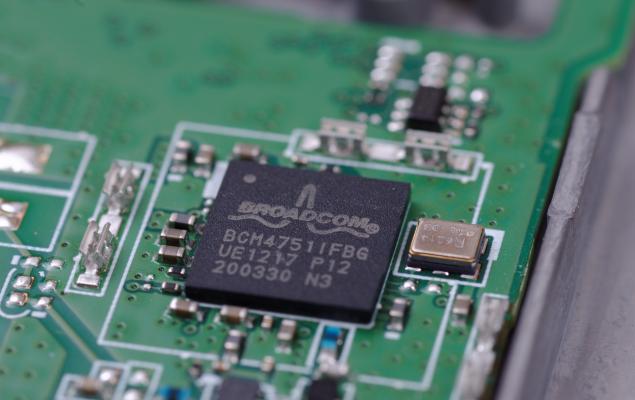
Chipmaker Broadcom AVGO has reached a milestone valuation of $1 trillion, following a 24.4% surge in its shares on Friday – its best trading day on record. With this gain, Broadcom becomes just the ninth...

The semiconductor powerhouse reported AI product sales are expected to grow by 65% in the fiscal first quarter.
The artificial intelligence (AI) revolution extends far beyond chatbots and automation to fundamentally restructure information processing, decision-making, and infrastructure development. According to...

The semiconductor sector has been on a remarkable rally in the past month. The expansion of artificial intelligence (AI) applications and the new monetary easing era led to a rally in semiconductor stocks....

The semiconductor sector, which was riding high on the expansion of artificial intelligence (AI) applications, faltered on the fading AI craze and tech sell-off in August and weak demand from China. However,...
Semiconductor sales are on the rise as the industry continues to grow rapidly; ETFs allow investors broad access to the space.

ON Semiconductor has had a rough 2024 when it comes to sales and its stock price. However, its made improvements that set it up for success when demand returns.

Marvell Technologies is seeing rapid growth in its data center business, but significant other challenges remain for the firm.

This is NOT like it was in 2017-2018 - when Trump started his previous presidency.

FX Spot+ bridges OTC spot FX traders with our vast futures liquidity, offering enhanced trading opportunities.

AUDNZD can be finally turning bearish, as we see a completed correction within the downtrend by Elliott wave theory.

What is Trading at Settlement on Bitcoin and Micro Bitcoin futures and what are the benefits? Find answers to these questions and more in our FAQ.

There are two ways in which one could see this, but one is confirmed by technicals.

Cable Is In Strong Recovery With Room For More Gains, as we see an unfinished lower degree five-wave impulse by Elliott wave theory.

Uncertainty in the markets, geopolitical risks, and tariffs will likely remain dominant, and any positive dollar reaction in the near term should be just a temporary move within the ongoing weakness, which...

CRB Is Trying To Continue Lower Along With DXY within a deeper corrective decline by Elliott wave theory due to a nice positive correlation.

DXY/ZN ratio chart is pointing much lower, which can keep U.S. Dollar under bearish pressure from technical and Elliott Wave Perspective.

As we approach a week packed with critical economic data releases, investors will closely monitor key indicators that could shed light on inflation trends, manufacturing activity, and overall economic...

This is NOT like it was in 2017-2018 - when Trump started his previous presidency.

FX Spot+ bridges OTC spot FX traders with our vast futures liquidity, offering enhanced trading opportunities.

AUDNZD can be finally turning bearish, as we see a completed correction within the downtrend by Elliott wave theory.

What is Trading at Settlement on Bitcoin and Micro Bitcoin futures and what are the benefits? Find answers to these questions and more in our FAQ.

There are two ways in which one could see this, but one is confirmed by technicals.

Cable Is In Strong Recovery With Room For More Gains, as we see an unfinished lower degree five-wave impulse by Elliott wave theory.

Uncertainty in the markets, geopolitical risks, and tariffs will likely remain dominant, and any positive dollar reaction in the near term should be just a temporary move within the ongoing weakness, which...

CRB Is Trying To Continue Lower Along With DXY within a deeper corrective decline by Elliott wave theory due to a nice positive correlation.

DXY/ZN ratio chart is pointing much lower, which can keep U.S. Dollar under bearish pressure from technical and Elliott Wave Perspective.

As we approach a week packed with critical economic data releases, investors will closely monitor key indicators that could shed light on inflation trends, manufacturing activity, and overall economic...
| Name | % Holdings |
|---|---|
| Broadcom Ltd | 13.87% |
| Nvidia Corp | 10.85% |
| Adv Micro Devices | 6.24% |
| Marvell Technology Inc | 5.00% |
| K L A-Tencor Corp | 4.58% |
| Taiwan Semiconductor ADR | 4.43% |
| Lam Research Corp | 4.36% |
| Asml Holdings NY Reg ADR | 4.18% |
| Qualcomm Inc | 4.15% |
| Applied Materials | 4.07% |
| 3rd Resistance Point | 35.91 |
| 2nd Resistance Point | 35.17 |
| 1st Resistance Point | 34.59 |
| Last Price | 34.00 |
| 1st Support Level | 33.27 |
| 2nd Support Level | 32.53 |
| 3rd Support Level | 31.95 |
| 52-Week High | 46.82 |
| Fibonacci 61.8% | 41.36 |
| Fibonacci 50% | 39.67 |
| Fibonacci 38.2% | 37.99 |
| Last Price | 34.00 |
| 52-Week Low | 32.53 |