The Quote Overview page gives you a snapshot view for a specific symbol. Real-time prices are provided by Cboe BZX Exchange on individual U.S. equities quote pages. During market hours, the real-time Cboe BZX price displays and new trade updates are updated on the page (as indicated by a "flash"). Volume always reflects consolidated markets. If the symbol has pre-market or post-market trades, that information will also be reflected along with the last (closing) price from the symbol's exchange. Real-time prices are available during market hours (9:30 AM to 4:00 PM EST).
Note: The Cboe BZX Exchange currently accounts for approximately 11-12% of all U.S. equity trading each day. As a result, the real-time prices displayed may have minor discrepancies when comparing the information with other sites offering real-time data, or with brokerage firms. If you require comprehensive real-time bids/asks/quotes, we offer a no-risk trial to one of our real-time products.
Barchart Symbol Notes Tutorial (8:43)
Summary Quoteboard
The Summary Quoteboard displays snapshot quote data. When available, Bid and Ask information from the Cboe BZX Exchange is updated as new data is received. Volume is also updated but is the delayed consolidated Volume from the symbol's exchange. Quoteboard data fields include:
- Day High / Low: The highest and lowest trade price for the current trading session.
- Open: The opening price for the current trading session is plotted on the day's High/Low histogram.
- Previous Close: The closing price from the previous trading session.
- Bid: The last bid price and bid size.
- Ask: The last ask price and ask size.
- Volume: The total number of shares or contracts traded in the current trading session.
- Average Volume: The average number of shares traded over the last 20 days.
- Weighted Alpha: A measure of how much a stock or commodity has risen or fallen over a one-year period. Barchart takes this Alpha and weights this, assigning more weight to recent activity, and less (0.5 factor) to activity at the beginning of the period. Thus, Weighted Alpha is a measure of one-year growth with an emphasis on the most recent price activity.
Chart Snapshot
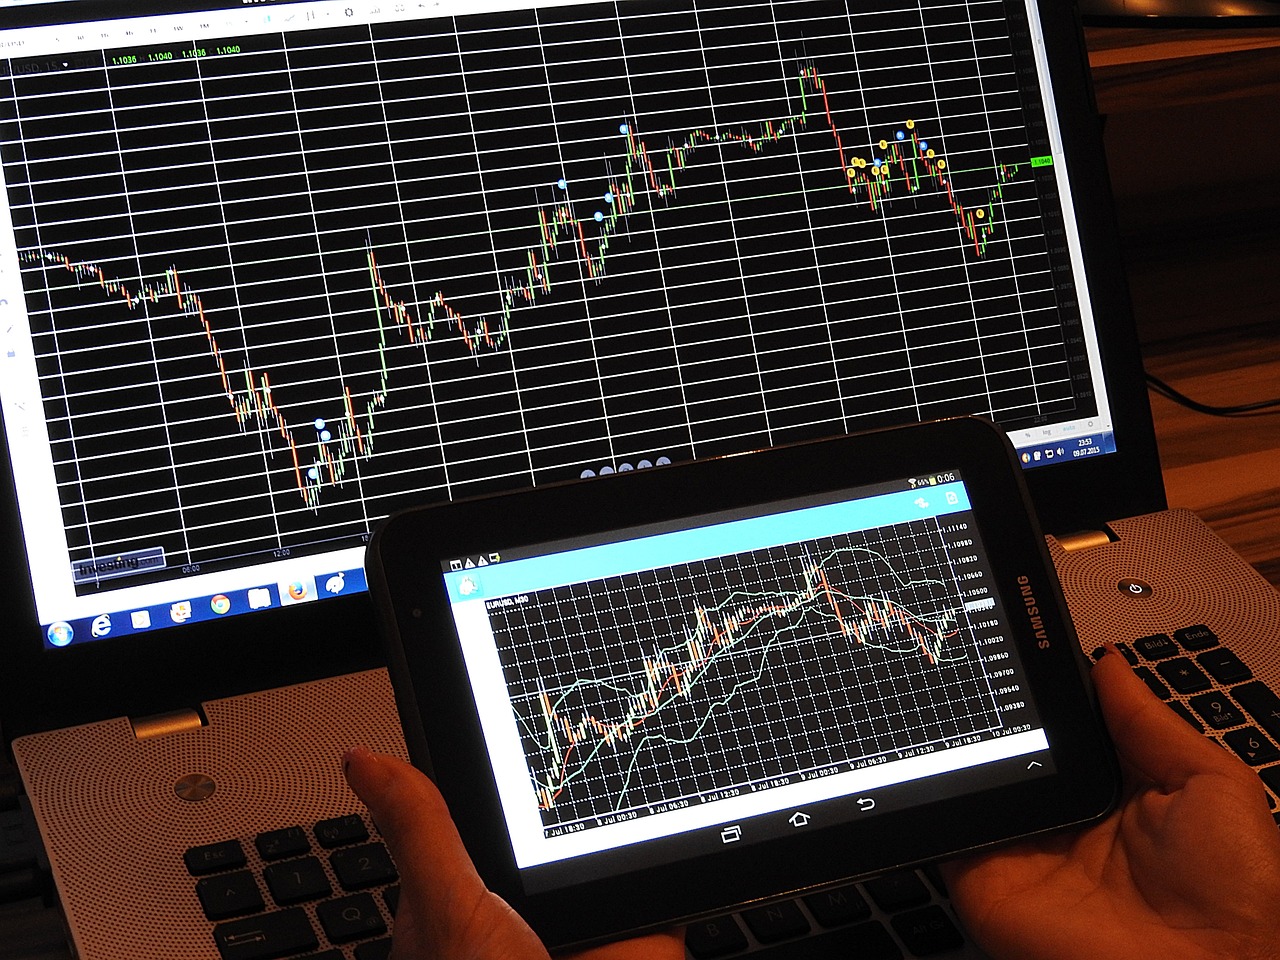
A thumbnail of a daily chart is provided, with a link to open and customize a full-sized chart.
Barchart Technical Opinion
The Barchart Technical Opinion widget shows you today's overall Barchart Opinion with general information on how to interpret the short and longer term signals. Unique to Barchart.com, Opinions analyzes a stock or commodity using 13 popular analytics in short-, medium- and long-term periods. Results are interpreted as buy, sell or hold signals, each with numeric ratings and summarized with an overall percentage buy or sell rating. After each calculation the program assigns a Buy, Sell, or Hold value with the study, depending on where the price lies in reference to the common interpretation of the study. For example, a price above its moving average is generally considered an upward trend or a buy.
The Opinion will show on the Quote Overview Page for all asset classes with this exception: For all U.S. Stocks, the Market Cap must be greater than $1B.
A symbol will be given one of the following overall ratings:
- Strong Buy (greater than "66% Buy")
- Buy (greater than or equal to "33% Buy" and less than or equal to "66% Buy")
- Weak Buy ("0% Buy" through "33% Buy")
- Hold
- Strong Sell (greater than "66% Sell")
- Sell (greater than or equal to "33% Sell" and less than or equal to "66% Sell")
- Weak Sell ("0% Sell" through "33% Sell")
The current reading of the 14-Day Stochastic indicator is also factored into the interpretation. The following information will appear when the following conditions are met:
- If the 14-Day Stochastic %K is greater than 90 and the Overall Opinion is a Buy, the following displays: "The market is in highly overbought territory. Beware of a trend reversal."
- If the 14-Day Stochastic %K is greater than 80 and the Overall Opinion is a Buy, the following displays: "The market is approaching overbought territory. Be watchful of a trend reversal."
- If the 14-Day Stochastic %K is less than 10 and the Overall Opinion is a Sell, the following displays: "The market is in highly oversold territory. Beware of a trend reversal."
- If the 14-Day Stochastic %K is less than 20 and the Overall Opinion is a Sell, the following displays: "The market is approaching oversold territory. Be watchful of a trend reversal."
Business Summary
Provides a general description of the business conducted by this company.
Price Performance
This section shows the Highs and Lows over the past 1, 3 and 12-Month periods. Click the "See More" link to see the full Performance Report page with expanded historical information.
Fundamentals
- For US and Canadian Stocks, the Overview page includes key statistics on the stock's fundamentals, with a link to see more.
- Market Cap: capitalization or market value of a stock is simply the market value of all outstanding shares. It is computed by multiplying the market price by the number of outstanding shares. For example, a publicly held company with 10 million shares outstanding that trade at $10 each would have a market capitalization of $100 million.
- Shares Outstanding: Common shares outstanding as reported by the company on the 10-Q or 10-K.
- Annual Sales: The annual sales, expressed in millions of dollars.
- Annual Income: The annual net income, expressed in millions of dollars.
- 60-Month Beta: Coefficient that measures the volatility of a stock's returns relative to the market (S&P 500). It is based on a 60-month historical regression of the return on the stock onto the return on the S&P 500.
- Price/Sales: Latest closing price divided by the last 12 months of revenue/sales per share.
- Price/Cash Flow: Latest closing price divided by the last 12 months revenue/cash flow per share.
- Price/Book: A financial ratio used to compare a company's current market price to its book value.
- Price/Earnings: Latest closing price divided by the earnings-per-share based on the trailing 12 months. Companies with negative earnings receive an "NE."
- Earnings Per Share: The trailing 12 months EPS from total operations is the bottom line income after all expenses, divided by the weighted average number of common shares outstanding. For example, if a company has $10 million in net income and 10 million in outstanding shares, then its EPS is $1.
- Most Recent Earnings: The amount of latest Earnings Per Share (EPS) paid out to shareholders and the date paid. Most Recent Earnings figures are based on Non-GAAP income from continuing operations.
- Next Earnings Date: The next reported earnings date, or the latest earnings date as reported by the company (if no future date has been released). Stocks whose Next Earnings Date falls within the next 28 days are highlighted in red. In addition, we indicate whether earnings are released Before Market Open (BMO), After Market Close (AMC), and in the case where no time is announced, you will see this labeled as (--).
- Annual Dividend Rate: The annual dividend paid over the trailing twelve months. The dividend rate is the portion of a company's profit paid to shareholders, quoted as the dollar amount each share receives (dividends per share).
- Annual Dividend Yield: The annual dividend yield, calculated from the trailing twelve months dividend. Yield is the amount of dividends paid per share, divided by the closing price.
- Most Recent Dividend: The most recent dividend paid and the most recent ex-dividend date.
- Sectors: Links to the Industry Groups and/or SIC codes in which the stock is found.
Options Overview
Highlights important summary options statistics to provide a forward looking indication of investors' sentiment.
- Implied Volatility: The average implied volatility (IV) of the nearest monthly options contract that is 30-days or more out. IV is a forward looking prediction of the likelihood of price change of the underlying asset, with a higher IV signifying that the market expects significant price movement, and a lower IV signifying the market expects the underlying asset price to remain within the current trading range.
- 30-Day Historical Volatility: The average deviation from the average price over the last 30 days. Historical Volatility is a measurement of how fast the underlying security has been changing in price back in time.
- IV Percentile: The percentage of days with IV closing below the current IV value over the prior 1-year. A high IV Percentile means the current IV is at a higher level than for most of the past year. This would occur after a period of significant price movement, and a high IV Percentile can often predict a coming market reversal in price.
- IV Rank: The current IV compared to the highest and lowest values over the past 1-year. If IV Rank is 100% this means the IV is at its highest level over the past 1-year, and can signify the market is overbought.
- IV High: The highest IV reading over the past 1-year and date it happened.
- IV Low: The lowest IV reading over the past 1-year and date it happened.
- Put/Call Vol Ratio: The total Put/Call volume ratio for all option contracts (across all expiration dates). A high put/call ratio can signify the market is oversold as more traders are buying puts rather than calls, and a low put/call ratio can signify the market is overbought as more traders are buying calls rather than puts.
- Today's Volume: The total volume for all option contracts (across all expiration dates) traded during the current session.
- Volume Avg (30-Day): The average volume for all option contracts (across all expiration dates) for the last 30-days.
- Put/Call OI Ratio: The put/call open interest ratio for all options contracts (across all expiration dates).
- Today's Open Interest: The total open interest for all option contracts (across all expiration dates).
- Open Int (30-Day): The average total open interest for all option contracts (across all expiration dates) for the last 30 days.
Related Stocks
For comparison purposes, find information on other symbols contained in the same sector.
Most Recent Stories
View the latest top stories from the Associated Press or Canadian Press (based on your Market selection).


